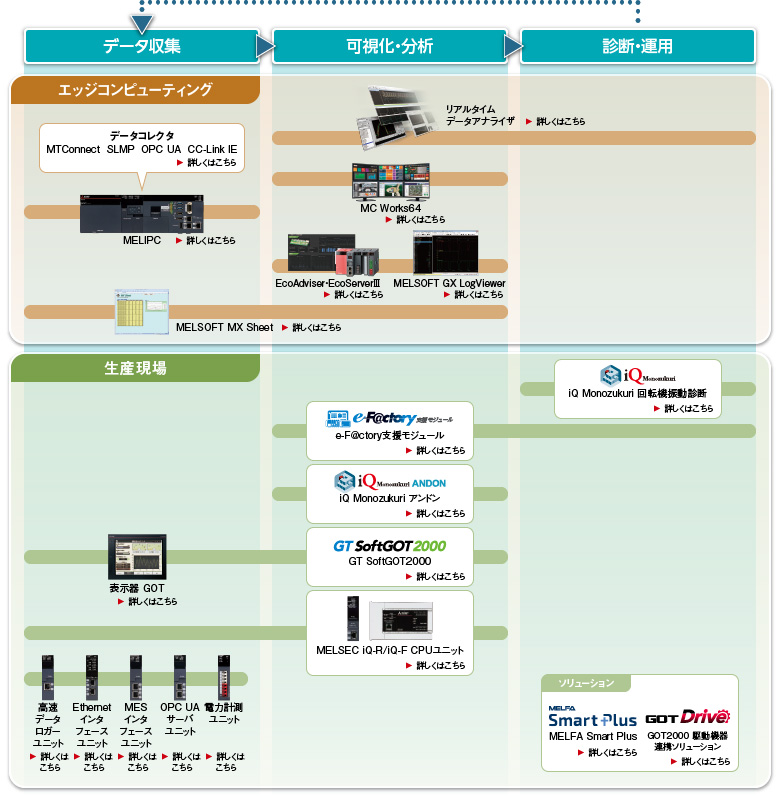
Data collection / analysis solution
Mitsubishi Electric FA product lineup
EcoAdviser Energy Saving Analysis Application EcoServerⅢ Energy Saving Data Collection Server
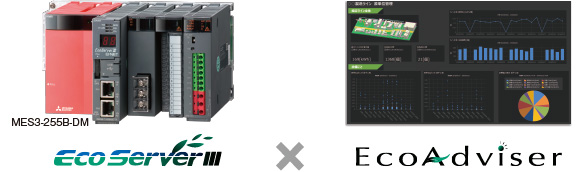
Ideal for those who want to realize simple energy-saving visualization without spending engineering cost! By using EcoServer III, you can collect the data of measuring instruments (energy) and sequencers (production) connected to the network with simple settings. The collected data can be easily graphed and analyzed by EcoAdviser, or the created graphs can be freely combined to build a dashboard.
Select from 7 types of graphs according to the content you want to analyze

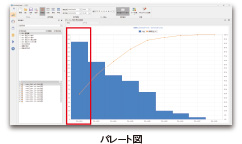
In addition to time series, percentage display and ranking display are possible, so it can be used for prioritizing energy conservation
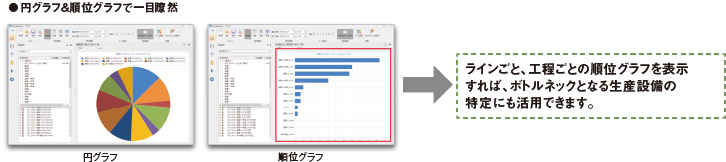
Even for production lines with multiple products, basic unit management by product type
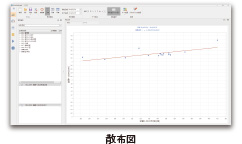
Two-factor correlation
Understanding production efficiency by correlating production and energy consumption
applied analysis
error history
Understanding the error content to be dealt with
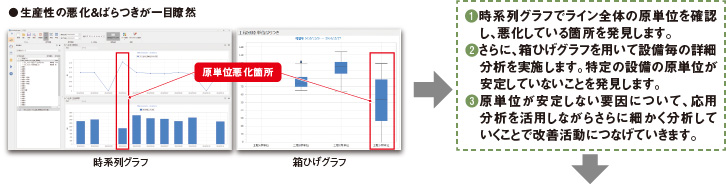
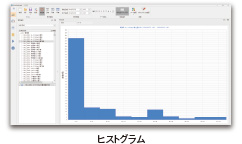
threshold / target value diagnosis
Grasp the distribution of values for each interval and use it as a guide for thresholds and target values
 Contact Us
 Call Center