Solutions
Data collection / analysis solution
Mitsubishi Electric FA product lineup
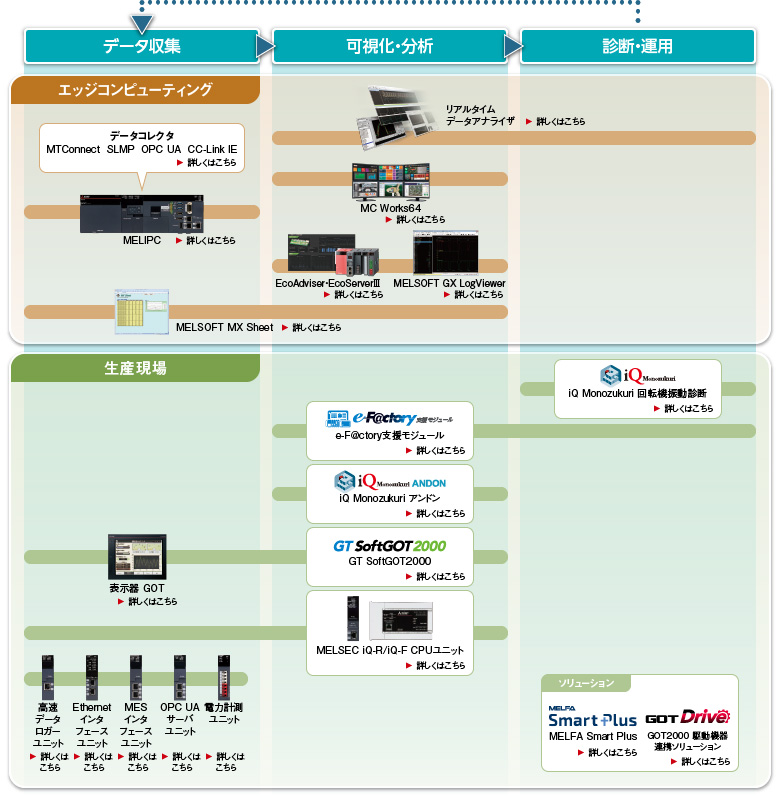
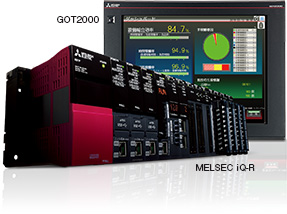
eF @ ctory support module
The eF @ ctory support module is a sample project for the programmable controller MELSEC iQ-R series and display unit GOT2000 series. It is not necessary to create a sophisticated analysis algorithm or draw a graph, and a system for analysis and diagnosis can be realized at low cost.
Display screen example for GOT2000 series * 1
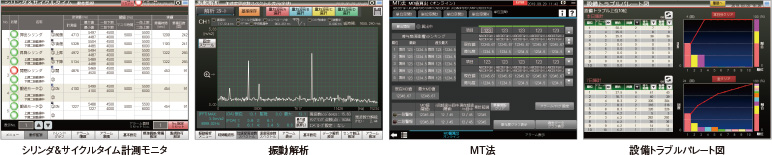
* 1. The screen image may change without notice.
There are two ways to provide: "Providing multiple functions", which is a collection of multiple functions, and "Providing individual functions."
Providing multiple functions
| Name | Overview |
|---|---|
| Facility operation monitoring solution | |
| Dashboard | Comprehensive display of equipment production and operation status such as total equipment efficiency and number of production |
| Production count | Set the time zone and product type, and aggregate and display the production status by time period and product type |
| Process capability index (histogram) | Data collected from equipment is displayed in a histogram to calculate process capability index |
| Operation status monitor | Display the daily operating status of equipment in a graph format |
| Cylinder & cycle time measurement monitor | Cylinder status and operation, equipment operation cycle is measured and monitored to monitor for signs of abnormality |
| Abnormal sign inspection | Monitors the error sign signal and displays the pre-registered remedy method when the error sign occurs |
| Abnormal stop measures | Monitors abnormal stop signals and displays pre-registered remedies when an abnormal stop occurs |
| Equipment trouble Pareto diagram | Abnormal stop alarm status due to reduced utilization rate is displayed using Pareto chart |
| Control chart (X bar R) | Display data collected from equipment as Xbar-R control chart in real time |
| Lost time analysis | Measures equipment non-operation time for each factor and displays the ratio by cumulative / time zone / day |
| Basic unit management | Energy consumption is calculated by monitoring power consumption, etc. |
| MT method simple diagnosis solution | |
| MT method * 2 | The MT method digitizes the discrepancy between normal data and input data. It is possible to input the feature amount calculated by the functions of vibration analysis and time series data collection. |
| Vibration analysis (FFT) | Frequency analysis (FFT) of vibration waveforms and monitoring of OA (overall value) etc. |
| Time series data collection | Collects time-series data and calculates nine types of feature quantities such as basic statistics |
* 2. MT stands for Maharanobis-Taguchi
Providing a single function
| Name | Overview |
|---|---|
| Vibration analysis | Frequency analysis (FFT) of vibration waveforms and monitoring of OA (overall value) etc. |
| Waveform guard band monitoring | Guardband monitoring of any analog input waveform |
| Correlation coefficient / coefficient of determination | Calculates and displays the correlation coefficient and coefficient of determination of the two types of collected data |
 Contact Us
 Call Center