Energy saving solution
Collects information on a production line consisting of multiple equipment. With the "Energy Saving Support Application EcoAdviser", the measured / saved data is graphed from various viewpoints / methods, and the improvement measures are guided by the problem analysis and the cause analysis based on the objective analysis.
The program-less customizable dashboard function makes it easy to identify bottleneck processes. The improvement measures derived from the analysis results will lead to facility and operational improvements.
EcoAdviser also supports Edgecross. You can also collect information from production lines that consist of multiple vendors.

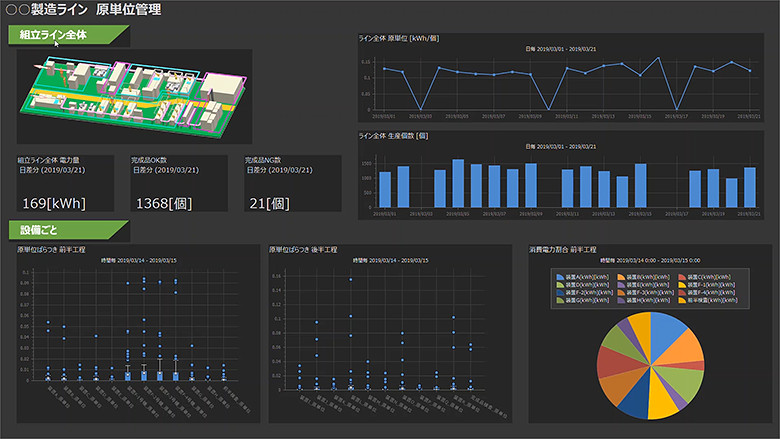
A bird's-eye view with a customizable dashboard function.
By narrowing down the whole factory ⇒ line ⇒ process / equipment, it is possible to identify the bottleneck process of energy and production.
Furthermore, it is possible to lead to improvement by analyzing operational management problems from the operating status.
* If you have any questions about EcoAdviser, please contact us from here.
EcoAdviser Features 1
Supports energy-saving analysis from multiple perspectives using the viewpoint x method
- By measurement item
- By date and time
-
By group
(by process, product type, etc.)

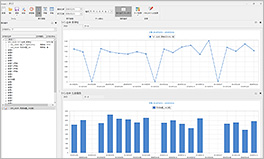
- Time series (line, bar, stacked graph, etc.)
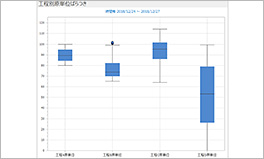
- Variation / stability comparison (box plot)
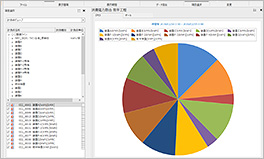
- Ratio (pie chart)
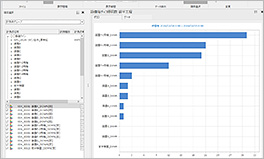
- Ranking (horizontal bar graph)
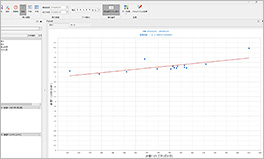
- Correlation (scatter plot)
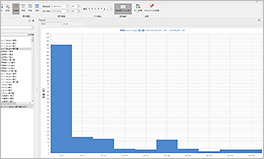
- Distribution (histogram)
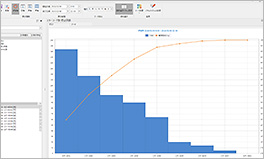
- Factors (Pareto chart)
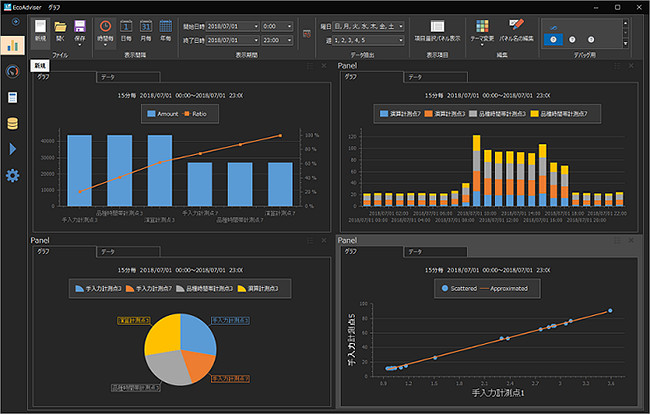
In addition to time-series comparison display of measurement data, analysis / aggregation graph from each viewpoint supports analysis
Collect energy and production information for multiple processes
make it possible to grasp operational problems from multiple angles.
EcoAdviser Features 2
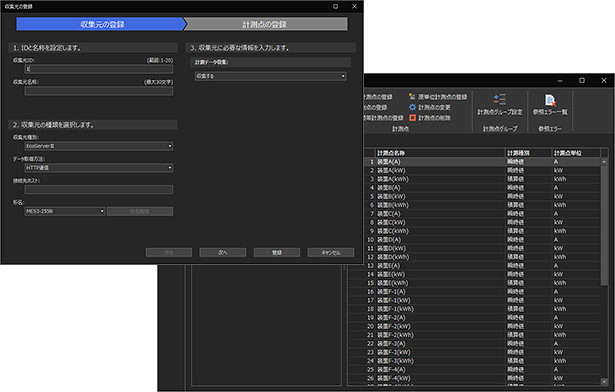
System configuration with simple settings (no program)
1) Noneed for individual manufacturing or engineering. The system can be started up and measurement points can be added or expanded just by setting. It is also possible to import the setting values of EcoServerⅢ and Edgecross.
Setting screen image
2)A dashboard GUI with customizable screens is available. The layout of graphs, size changes, reading of arbitrary images, etc. can be easily done with the mouse, and the screen can be customized with your favorite layout.
Select viewpoint x method
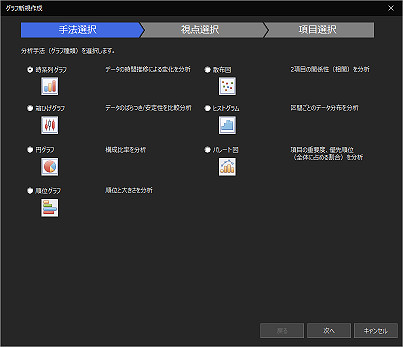

Create an analysis graph according to the application
EcoAdviser Features 3
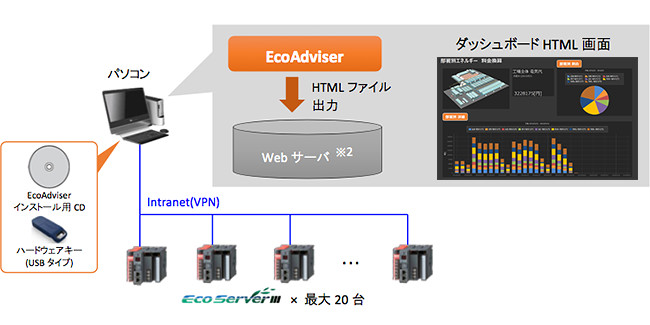
Control multiple EcoServer III. Easy to expand
1)Collect data from multiple EcoServer III. It is possible to manage multiple sites collectively. * 1
* 1VPN connection between bases is required.
2)HTML file output function allows visualization (system extension).
HTML output of the created dashboard screen is possible.
If you set up a WEB server on your PC, you can browse the dashboard HTML screen on the intranet. * 2
* 2WEB server setup is required on the personal computer.
 Contact Us
 Call Center